Courtesy of Fangraphs.com, here is the Win Probability chart for last night's game.

Today at 1:10pm central time Francisco Liriano will face off against Ubaldo Jimenez in a matchup of two of the best young pitchers in baseball. Jimenez is having a Cy Young type season, 12-1 so far with a sparkling 1.16 ERA. Liriano isn't doing too shabby himself, going 6-3 with a 2.90 ERA. But this is the same type of comparison you will get before the game today by the studio announcers looking to "break down" the match-up, let's delve a little deeper and see what's really going on with these two pitchers. First we'll look at the two pitchers peripheral numbers to see how they compare.

Except for total innings pitched, Liriano has been significantly better this year, striking out almost two more batters per 9 innings, walking close to one less and allowing slightly fewer homeruns (although you could argue Liriano has been a bit lucky in regard to homeruns allowed). So what has allowed Jimenez to put up such ridiculous numbers so far this year?
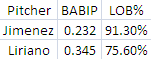
Jimenez is playing way above his head in terms of BABIP and LOB%, his career BABIP is .282 and for LOB% it's 73.8, so we can expect some serious regression of those two numbers going forward. Liriano meanwhile sports a career .316 BABIP and 71.6 LOB%, so any regression he experiences will likely go in his favor.
So what about that 1.16 ERA that Jimenez has right now? That's pretty good right?

Not according to FIP. Don't get me wrong, a 2.93 FIP is nothing to laugh at, but it's quite a bit worse than Liriano's 2.11. It's even more apparent how badly ERA is overstating Jimenez's performance when you look at E-F, the delta between ERA and FIP. Even when you use the xFIP stat, which normalizes the Home Run's allowed component (which should account for Liriano's Home Run luck), Liriano is still having the better season, in fact Liriano is ranked second in FIP, first in xFIP and second in WAR among all pitchers.
Ubaldo Limenez is having a fantastic season by the traditional pitching metrics, wins and ERA. Francisco Liriano is having the better season, it just doesn't show up as well in the traditional stats.
Currently the Tampa Bay Rays are tied with the New York Yankees for the best record in the majors at 41-23 and while this level of successes was certainly unexpected, they are fundamentally a good team. Are they playing above their heads? Let's take a look at a few different metrics and what they tell us about the Ray's play this year.
BABIP
The Rays pitching staff right now sports a .283 BABIP, the fourth best in MLB, behind the Giants, Padres and Yankees. Last year, with essentially the same defense, the Ray's put up a league average .299, so you would expect this number to regress to average over the course of the season.
LOB%
The Rays are currently stranding 77.2% of hitters who reach base, the second best in baseball behind the Padres. Last year the Ray's had a 71.2 LOB%, again right around league average, so just like BABIP this number should decrease as the season goes on. So more balls will fall in for hits and more base runners will end up scoring, meaning the Ray's will allow more runs going forward then they have up until now.
E-F
E-F is the delta between a pitchers ERA and FIP, essentially a measure of how "wrong" a pitchers ERA is. In this metric the Ray's lead the league at -.66, in other words their ERA is .66 points better than it should be based on peripheral stats. Their lower than it should be ERA is another indicator that the Ray's have been getting lucky.
GB/FB
There aren't really any stats that support their current level of pitching, they don't have a bunch of ground ball machines on their staff, they are in the bottom third of baseball in GB%. Not only that, they are in the top third of baseball in FB% and their GB/FB ratio is in the bottom third at 1.08. So the only real explanation for their pitchers numbers in the previous categories is luck.
WPA
WPA is a real time measure of a player's impact on a game. A team's chance of winning is calculated before and after each at bat and the difference in the probability is awarded to the players involved. When you then look who's contributed to the Rays wins this year via WPA its clear their pitching is the main reason for their early success. Ray's pitchers are second in the majors in WPA at 7.68. Their hitters however are seventh at 1.32. That's a 5.82 ratio between the contributions of the pitchers and the contributions of the hitters.
Expected W-L
So let's figure out what the Ray's W-L would be if they had done only as well as FIP suggests they should have. They are currently one game behind their Pythagorean W-L, so we will use FIP to estimate how many runs the Ray's should have allowed and use that number to figure out a new W-L via the Pythagorean method. So the Ray's have a 4.11 FIP right now, that translates to 264 earned runs allowed, plus the 18 unearned runs allowed equals 282 runs allowed. When you plug that into the Pythagorean equation you get a 59% winning percentage for an expected wins of 38, three less then they now have, but still good for the second best record in baseball.
So while they may have over performed to some degree, they are still one of the best teams in baseball this year and look to continue that through the rest of the season. It may not matter in the end, they are in the toughest division in baseball and both the Red Sox and Yankees have struggled with injuries to this point. But make no mistake about it, the Ray's should make a race out of it for the duration of the season.
| Year | BB% | K% | ISO | OPS+ | UZR | WAR |
| 2008 | 5.6 | 18.3 | .115 | 100 | -19.4 | -0.7 |
| 2009 | 2.9 | 23.3 | .142 | 91 | -14.3 | -1.1 |
| Year | BB% | K% | ISO | OPS+ | UZR | WAR |
| 2010 | 6.6 | 12.3 | .196 | 112 | 0.4 | 0.8 |
| Year | BABIP |
| 2007 | 0.338 |
| 2008 | 0.338 |
| 2009 | 0.338 |
| 2010 | 0.276 |
Take a look at these two pitching lines from last night's game versus the A's.
| Pitcher | IP | H | R | ER | BB | SO | HR |
| Liriano | 7 | 5 | 1 | 1 | 2 | 10 | 0 |
| Burnett | .1 | 0 | 0 | 0 | 0 | 0 | 0 |
Guess who got credit for the win?