Saturday, July 17, 2010

Do the Twins need an Ace?

The Conventional Wisdom right now among the chattering classes is that the Twins absolutely need to get an "Ace" pitcher if they want to compete in the playoffs this year, or even make it to the playoffs for that matter. I heard this very thing on MPR on Tuesday morning from Howard Sinker, the Star Tribune's Twins blogger. There are many things about what Howard Sinker had to say in that interview that I fundamentally disagree with but the most egregious, in my view, is his complete lack of respect for the performance of one of the Twins starting pitchers. From the interview:
Four fifths of the starting rotation, really everybody except for Carl Pavano, has flown off badly in one way or another.
This was said in the context of discussing who was under performing on the team. What "flown off badly" means I'm not exactly sure, but to completely disregard the first half performance of Francisco Liriano would fall into the same category of "flying off badly."

Here's the stats of the entire Twins staff, the standard baseball stats everyone is familiar with and WHIP, walks + hits per inning, which is starting to be published in newspapers more often these days (all stats used in this post were as of the All Star break).


So right off the bat we can see that Howard Sinker doesn't know what he's talking about. Clearly Nick Blackburn has been terrible, but Scott Baker and Kevin Slowey have both been decent enough, they are on pace for about 200 innings of sub 5 ERA baseball. While that is not world beating, it is certainly acceptable from your third and forth starters. What you can see even looking at the standard stats though is that Francisco Liriano is at least the Twins second best pitcher and other than the fact that he has a losing record, is doing at least as well as Pavano. And about that losing record, in case there's anyone who thinks wins actually mean anything, here's a graphic you should see.


Guess who got credit for the win in that game and I'll give you a hint, it wasn't Liriano. There are many, many discussions on the internet about the uselessness of the win stat in evaluating pitching performance, but leave it to the traditional sports media to completely ignore all of the work going on in the field of baseball stats these days and instead rely on outdated methods of judging player performance.

Here is a comparison of Carl Pavano and Francisco Liriano using some different metrics.


If you don't know what some of these stats are, that's fine, I'll explain them or at least attempt to. The first two are strikeouts (K/9) and walks (BB/9) per nine innings and the one after that is strikeout to walk ratio (K/BB). What we see here is that Liriano is striking out significantly more batters than Pavano and Pavano is walking fewer batters than Liriano. This gives them essentially the same K/BB ratio; it's getting into the next series of numbers where the two pitchers start to really diverge, before we get can do that however, we must define a few concepts.

The most import one to understand is a concept called "regression to the mean". Simply stated this means that if a player has been in the big leagues for eight years and is a career .280 hitter, but this year he's hitting .330, we can expect that his batting average going forward will regress to his mean of .280. This is not a baseball concept; it is a statistics concept that has applications in predicting future performance, in this case for baseball players.

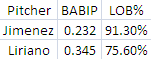
Also important to understand are a few of these advanced stats and what they mean; first BABIP, batting average on balls in play (from Baseball Prospectus):
Based on the research of Voros McCracken and others, BABIP is mostly a function of a pitcher's defense and luck, rather than persistent skill. Thus, pitchers with abnormally high or low BABIPs are good bets to see their performances regress to the mean. A typical BABIP is about .300.
This is an import concept that sometimes people have a hard time accepting, but what it means is that once a batter makes contact with a pitch there is nothing the pitcher can do about it anymore, it is out of the pitchers control weather that batted ball will fall for a hit or not. In other words there's nothing pitchers can do to prevent hits other than not letting batters make contact.

Another important stat that's related to this concept is FIP, fielding-independent pitching, a metric that forecasts a pitchers ERA based on their peripheral stats (from Hardball Times):
Fielding Independent Pitching, a measure of all those things for which a pitcher is specifically responsible. The formula is (HR*13+(BB+HBP-IBB)*3-K*2)/IP, plus a league-specific factor (usually around 3.2) to round out the number to an equivalent ERA number. FIP helps you understand how well a pitcher pitched, regardless of how well his fielders fielded.
What we can see by looking at the BABIP's of the two pitchers is that up to now Liriano has been exceptionally unlucky on batted balls while Carl Pavano has been exceptionally lucky. As the season goes on we can expect these numbers to regress to the mean of .300, meaning Liriano should give up fewer hits and Pavano should give up more.

This is supported by FIP, where Liriano is sporting a league best 2.18. That's league best as in all of Major League Baseball best; number two is Josh Johnson at 2.31 and number three is Cliff Lee at 2.58. That's Cliff "we absolutely must trade for him if we want to win a championship" Lee. You can also see by looking at the difference between his ERA and FIP (E-F) just how well he's doing compared to what his ERA says and just how badly his ERA is under valuing his performance to date.

The last metric is WAR, Wins Above Replacement, which is an estimation of how many wins a player adds versus a replacement level player, usually defined as an average AAA player. In that metric Francisco Liriano is currently third in all of baseball, behind only Roy Halladay at 4.6 and Josh Johnson at 4.4, again ahead of Cliff Lee who's at 3.8. If you also consider that the Twins are paying Liriano less money than Pavano, or any of those other pitchers for that matter, there is absolutely no question who the most valuable pitcher on the Twins staff has been so far this year and just how badly off the mark Howard Sinker is.

Sunday, June 20, 2010

The Comeback

Courtesy of Fangraphs.com, here is the Win Probability chart for last night's game.

Thursday, June 17, 2010

Liriano v Jimenez

Today at 1:10pm central time Francisco Liriano will face off against Ubaldo Jimenez in a matchup of two of the best young pitchers in baseball. Jimenez is having a Cy Young type season, 12-1 so far with a sparkling 1.16 ERA. Liriano isn't doing too shabby himself, going 6-3 with a 2.90 ERA. But this is the same type of comparison you will get before the game today by the studio announcers looking to "break down" the match-up, let's delve a little deeper and see what's really going on with these two pitchers. First we'll look at the two pitchers peripheral numbers to see how they compare.

Except for total innings pitched, Liriano has been significantly better this year, striking out almost two more batters per 9 innings, walking close to one less and allowing slightly fewer homeruns (although you could argue Liriano has been a bit lucky in regard to homeruns allowed). So what has allowed Jimenez to put up such ridiculous numbers so far this year?

Jimenez is playing way above his head in terms of BABIP and LOB%, his career BABIP is .282 and for LOB% it's 73.8, so we can expect some serious regression of those two numbers going forward. Liriano meanwhile sports a career .316 BABIP and 71.6 LOB%, so any regression he experiences will likely go in his favor.

So what about that 1.16 ERA that Jimenez has right now? That's pretty good right?

Not according to FIP. Don't get me wrong, a 2.93 FIP is nothing to laugh at, but it's quite a bit worse than Liriano's 2.11. It's even more apparent how badly ERA is overstating Jimenez's performance when you look at E-F, the delta between ERA and FIP. Even when you use the xFIP stat, which normalizes the Home Run's allowed component (which should account for Liriano's Home Run luck), Liriano is still having the better season, in fact Liriano is ranked second in FIP, first in xFIP and second in WAR among all pitchers.

Ubaldo Limenez is having a fantastic season by the traditional pitching metrics, wins and ERA. Francisco Liriano is having the better season, it just doesn't show up as well in the traditional stats.

Wednesday, June 16, 2010

Are the Rays for real?

Currently the Tampa Bay Rays are tied with the New York Yankees for the best record in the majors at 41-23 and while this level of successes was certainly unexpected, they are fundamentally a good team. Are they playing above their heads? Let's take a look at a few different metrics and what they tell us about the Ray's play this year.

BABIP

The Rays pitching staff right now sports a .283 BABIP, the fourth best in MLB, behind the Giants, Padres and Yankees. Last year, with essentially the same defense, the Ray's put up a league average .299, so you would expect this number to regress to average over the course of the season.

LOB%

The Rays are currently stranding 77.2% of hitters who reach base, the second best in baseball behind the Padres. Last year the Ray's had a 71.2 LOB%, again right around league average, so just like BABIP this number should decrease as the season goes on. So more balls will fall in for hits and more base runners will end up scoring, meaning the Ray's will allow more runs going forward then they have up until now.

E-F

E-F is the delta between a pitchers ERA and FIP, essentially a measure of how "wrong" a pitchers ERA is. In this metric the Ray's lead the league at -.66, in other words their ERA is .66 points better than it should be based on peripheral stats. Their lower than it should be ERA is another indicator that the Ray's have been getting lucky.

GB/FB

There aren't really any stats that support their current level of pitching, they don't have a bunch of ground ball machines on their staff, they are in the bottom third of baseball in GB%. Not only that, they are in the top third of baseball in FB% and their GB/FB ratio is in the bottom third at 1.08. So the only real explanation for their pitchers numbers in the previous categories is luck.

WPA

WPA is a real time measure of a player's impact on a game. A team's chance of winning is calculated before and after each at bat and the difference in the probability is awarded to the players involved. When you then look who's contributed to the Rays wins this year via WPA its clear their pitching is the main reason for their early success. Ray's pitchers are second in the majors in WPA at 7.68. Their hitters however are seventh at 1.32. That's a 5.82 ratio between the contributions of the pitchers and the contributions of the hitters.

Expected W-L

So let's figure out what the Ray's W-L would be if they had done only as well as FIP suggests they should have. They are currently one game behind their Pythagorean W-L, so we will use FIP to estimate how many runs the Ray's should have allowed and use that number to figure out a new W-L via the Pythagorean method. So the Ray's have a 4.11 FIP right now, that translates to 264 earned runs allowed, plus the 18 unearned runs allowed equals 282 runs allowed. When you plug that into the Pythagorean equation you get a 59% winning percentage for an expected wins of 38, three less then they now have, but still good for the second best record in baseball.

So while they may have over performed to some degree, they are still one of the best teams in baseball this year and look to continue that through the rest of the season. It may not matter in the end, they are in the toughest division in baseball and both the Red Sox and Yankees have struggled with injuries to this point. But make no mistake about it, the Ray's should make a race out of it for the duration of the season.

Friday, June 11, 2010

The Turnaround

Delmon Young came into this year as an underachieving former first round pick. Let's take a quick look at his numbers from the last two years to reinforce this point.

YearBB%K%ISOOPS+UZRWAR
20085.618.3.115100-19.4-0.7
20092.923.3.14291-14.3-1.1

In 2008 Delmon Young was an average hitter for his position and a below average fielder, this resulted in an overall negative value as seen in his WAR, wins above replacement. In 2009 he got worse in almost every hitting category, taking less walks and striking out more, trend lines that you don't want to see from any player, much less one as young as Delmon.

His OPS+, a comparison between him and everyone else at his position, was well below average. His fielding and power numbers improved slightly but not enough to offset the regression in his plate discipline and as a result his WAR in '09 was worse than in '08. At the end of the year Delmon Young looked like a failed prospect whose skill was deteriorating before our eyes.

When the Twins signed Jim Thome many a blogger suggested that the Twins best lineup would consist of Jason Kubel in left and Thome at DH, with Delmon on the bench.

So, what has Delmon Young done so far this year?

YearBB%K%ISOOPS+UZRWAR
20106.612.3.1961120.40.8

That's quite the dramatic turnaround, going from 9 points below average in OPS+ in '09 to 12 points above average so far this year. And it's not just one or two categories that he's improved, it is across the board. His walk rate is more than twice what it was last year and even though his strikeout rate is way down, his power numbers are up.

The most striking improvement though has been in his fielding. While the last two years Delmon Young was among one of the worst fielders at his position, this year he is average. All of this has resulted in him posting a .8 WAR so far, with half of the season still to play. Meaning that for the first time since he's been in a Twins uniform Delmon Young is providing positive value to his team.

A lot of ink was used in spring training talking about Delmon's weight loss in the off season and while I never try to take "he's in the best shape of his life" spring training stories seriously, it appears that it has made quite the difference in Delmon's ability to get to balls in the outfield, something he used to struggle mightily with.

So how do we know that this isn't just a first half fluke and his numbers will regress to normal as the season goes on? Well, take a look at Delmon's BABIP through the years.

YearBABIP
20070.338
20080.338
20090.338
20100.276

What you can see by the above chart is that Delmon has been very unlucky so far this year; his balls in play are falling for hits at an unsustainably low rate. As the season goes on his BABIP to regress towards his career average, when that happens 2010 will easily be Delmon Young's best year in the majors. It may not be enough to make the trade that brought him here approach parity, but it will certainly pull it out from the realm of one of the worst Twins trade's evah.

Sunday, June 6, 2010

Yet another reason why the win is the dumbest stat in baseball

Take a look at these two pitching lines from last night's game versus the A's.

PitcherIPH RERBBSOHR
Liriano75112100
Burnett.1000000

Guess who got credit for the win?